In our previous post we chose to cluster South American airports into \(k = 3\) distinct groups. Moving forward, we'll take a closer look into what this really means.
As mentioned previously, the k-means algorithm incorporates some element of mathematical randomness. On one k-means trial, the algorithm may assign 30% of our airports to Cluster 1, 65% to Cluster 2, and 5% to Cluster 3. Other times, this distribution could look more like 35%, 55%, and 10% respectively. The more clusters we input, or the larger we make k, the less the distributions vary by trial.
Irrespective, we previously deemed \(k = 3\) to be the way to go, informed by statistical methods and not by counting the number of McDonald's each airport houses, so with \(k = 3\) we will proceed. Qualitatively, these clusters can be said to define airports as "major" airports, "semi-major" airports, and "non-major" airports.
In addition to cluster sizes varying by trial, the actual number assigned to each cluster - 1, 2, or 3 - will vary by trial as well. For example, in Argentina, Buenos Aires' international airport is assumed to be consistently placed in the cluster pertaining to "major" airports; however, the cluster number assigned to this group on a given trial could be 1, 2, or 3. Below is a histogram of cluster sizes across 100 k-means trials for the 293 South American airports being examined.
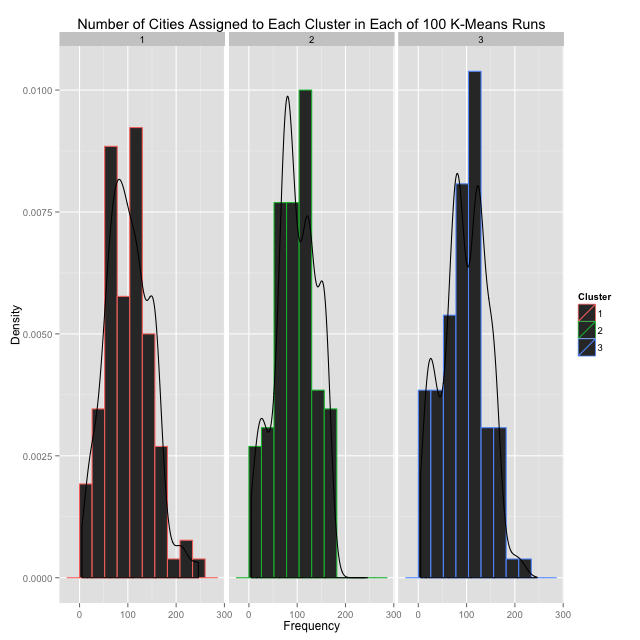
Since numbers assigned to each cluster (1, 2, or 3) change by trial, this graph isn't particularly useful. However, it does given significant evidence that cluster sizes will indeed vary by trial, which we'll use later on. As such, it follows that clusters should not be judged by their respective cluster numbers, but rather, by the mean "centers" values associated with the airports grouped within. This is what really defines the clusters themselves, or in other words, what makes each cluster pertain to "major," "semi-major," and "non-major" air hubs (I'll continue to keep these words in quotations, since k-means clustering is ultimately an attempt to give a quantitative definition to an ultimately qualitative distinction, which is always, at best, an approximation).
Upon first examining which airports were actually clustered together - and again, we're using \(k = 3\), and considering all routes between all airports in South America - it is immediately clear that airports from the same country are consistently put into the same cluster groups. Even though Buenos Aires' airport, with 50 distinct routes continent-wide, and Santa Rosa, Argentina's airport, with only 1 distinct route continent-wide (that being to Buenos Aires), are clearly categorically different in "major-ness," they are consistently put into the same cluster. This is probably for one or both of the following reasons: "non-major" airports are "piggy-backing" onto the more "major" domestic airports in their respective countries (as they are generally just 1 flight away, as is the case with Santa Rosa); or, the extensiveness of the domestic air network itself outweighs the international, continent-wide connectivity that a single airport can offer, therefore grouping "major" and "non-major" airports from the same country together more frequently than "major" and "semi-major" airports from different countries. Clearly, our goal is to consistently have, at a minimum, the continent's most "major" airports grouped together - those of Buenos Aires, São Paulo, Bogotá, Lima, and Santiago, for example - but unfortunately this is not the case. Back to the drawing board.
Instead, what I choose to do in this post is compare and contrast the clusterings of individual domestic networks. For this, I choose only the countries with at least 3 airports running domestic routes (as we of course need as many airports as we do clusters), being Argentina, Bolivia, Brazil, Chile, Colombia, Ecuador, Peru, and Venezuela. Our aim here to figure out the proportion of "major" airports, "semi-major" airports, and "non-major" airports in each country.
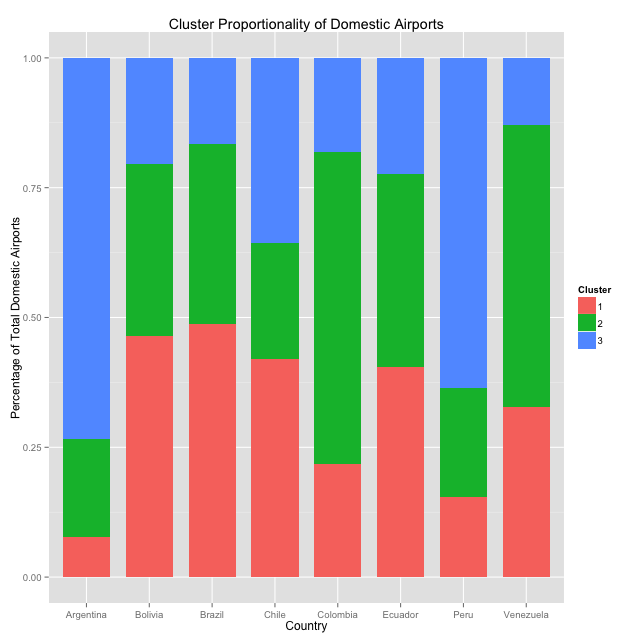
To do this, we first cluster and then examine the means of each cluster's centers. From there, we simply take the means - average shortest path lengths for airports in each cluster - and order from smallest to biggest. This will ensure that the smallest means correspond to our "major" airports, second-smallest means correspond to "semi-major" airports, and largest correspond to "non-major" airports. One problem still remains: cluster sizes will still vary by trial, as shown clearly in the graph above. Therefore, I run 100 k-means trials for each country, compute population proportions across these trials, and compare with a stacked-bar ggplot. The red bars are for "major" airports, green for "semi-major," and blue for "non-major."
# create stacked bar chart in ggplot
ggplot(km_by_country, aes(x=Country, y=FractOfWhole, fill=Cluster))
        + geom_bar(position="stack", stat="identity", width=0.75)
        + labs(
            y="Percentage of Total Domestic Airports",
            title="Cluster Proportionality of Domestic Airports"
        )
Now for the fun part.
First, we see that Argentina, Colombia, and Peru have comparatively few "major" airports; most routes in these countries will be sourced by a select few hubs. In Argentina, this is primarily Buenos Aires; in Colombia, primarily Bogotá and Cali (and to a surprising extent Rio Negro and San Andrés Island); and in Peru, primarily Lima. At the opposite end of the spectrum, Brazil and Bolivia house a relatively even distribution of airport types. In Brazil, this is likely due to the sheer volume and variety of domestic routes (~120 working airports), meaning that no matter where you are, you're never that far from anywhere else. In Bolivia, with only ~15 working airports, it seems that the load is simply shared rather evenly across the board, with no one airport as the single, outright major hub, and smaller airports servicing a nice handful of routes themselves.
So - what does this all mean? Countries with more evenly distributed "major," "semi-major," and "non-major" airports make travel much easier. If you're in Central Argentina and want to go somewhere by air, you're rather likely to require a layover in the nation's capital (which is not near the center of the country either) before moving to your destination. In Colombia, while there are many active airports, if you want to travel somewhere a bit "off-path" you're likely to require just a few more layovers than you had hoped. Lastly, if you're in Brazil, unless you're stuck on a canoe in the Amazon Rainforest, you're never really in the middle of logistical nowhere.
In a future post, it will be interesting to look more closely at the economic causes and effects for these air distributions. For now, let's just be thankful we're not gauchos in Patagonia planning a vacation.

Photo Credit: Jimmy Nelson