I've always been enchanted by the notion of encoding real-world entities into lists of numbers. In essence, I believe that hard truth is pristinely objective - like the lyrics of a song - and mathematics is the universe's all-powerful tool in expressing incontrovertibility.
One of the expressed goals of machine learning is to learn structure in data. First, data, in line with the notion above, is a record of a thing that happened, or is. For example, data could be a piece of paper that lists all of the sales my company made yesterday. In addition, data could be a photograph which captures (via numerical pixel values) and an instant in time.
So, what does structure in this data mean? Structure refers to patterns. Structure refers to high-level relationships and phenomena in this data. In the first case, finding structure could be discovering that Sunday is our most profitable day; in the second, structure could be discovering that in a large set of photographs of people, wherever we see a human nose, there are typically two eyes just above and a mouth just below.
In machine learning, discovering structure in data in an unsupervised fashion - and especially when dealing with image, audio or video data - is typically performed via auto-encoders. The job of an auto-encoder is similar to that of a data compression model: take the original data and reduce it into something smaller that, crucially, contains all of the information contained in the original. Said a different way, given the compressed representation of the data, we should be able to fully reconstruct the original input.
In this post, I set out to discover structure in world flags. Specifically, I'd like to know: "what are the features that comprise these flags?" If successful, I should be able to numerically encode a flag as not just its raw pixel values, but instead, "some red background, plus a green star in the middle" (in the case of Morocco). Of course, these features would only arise in a dataset full of flags: if viewed through the lens of pictures of cats, the Moroccan flag would instead be encoded as "a blood-red sunset, plus a cat in a green super-hero cape, minus the cat."
In the family of auto-encoders, the sparse auto-encoder is one of the simplest. In effect, this is a neural network with a single hidden layer which takes an image as input and learns to predict that image as output. The hidden layer is typically of a size smaller than the input and output layers, and has non-linear activations. Finally, a sparsity constraint is enforced such that the model favors having only a few non-zero hidden-layer activation values. For a given image, these activations are its compressed representation, i.e. it's "encoding."
With a trained sparse auto-encoder, we can do a few things.
- We can visualize the "features" each hidden-layer node is "looking for." These are the high-level features that characterize our data, i.e. stars, stripes and crescents in a dataset of flags.
- Take a composition of existing encodings and generate a composite flag. For example, feed \(\text{encoding}_{\text{colombia}} + \text{encoding}_{\text{laos}}\) into the hidden-layer of the network, pass it through to the final layer and see what results.
- Pass a vector of random values into our hidden-layer, pass it through to the final layer and generate a new flag entirely.
A more comprehensive technical primer on sparse auto-encoders is not the premise of this post, as I believe much better resources already exist. Here are a few links I like to get you started:
The following model was trained with a hand-rolled sparse auto-encoder found here. The technical specifications are as follows:
- Downsize images to \((68, 102, 3)\), which is roughly proportional to the largest bounding box of the originals. Then, flatten to vectors of \(68 * 102 * 3 = 20808\) values.
- Network dimensions are \((20808, 64, 20808)\).
- Learning rate \(\alpha = .05\).
- Training for 1000 epochs.
- Sparsity parameter \(\rho = .25\).
- Sparsity parameter in loss function \(\beta = .25\).
- Initialize weights and biases with Gaussian of \(\mu = 0\), \(\sigma = \frac{1}{\sqrt{20808}}\).
- The full dataset is of size \((138, 20808)\). Yes, it's tiny! Use the first 100 examples for training, the next 20 for validation, and the final 18 for testing.
First, let's see how well our network does. Again, its goal was to learn how to compress an image into a reduced representation containing enough information to recreate the original thereafter.
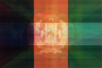
Here's an image of the downsized flag of Afghanistan as passed into our network:

So, this is as good as we're ever going to do. When we pass this into our network, here's what it predicts:
Not terrible. Of course, this could be improved with, squarely, more training data.
After training our auto-encoder, we solve for the 64 individual images that "maximally activate" each of the 64 "feature detectors," i.e. each of our hidden-layer nodes.
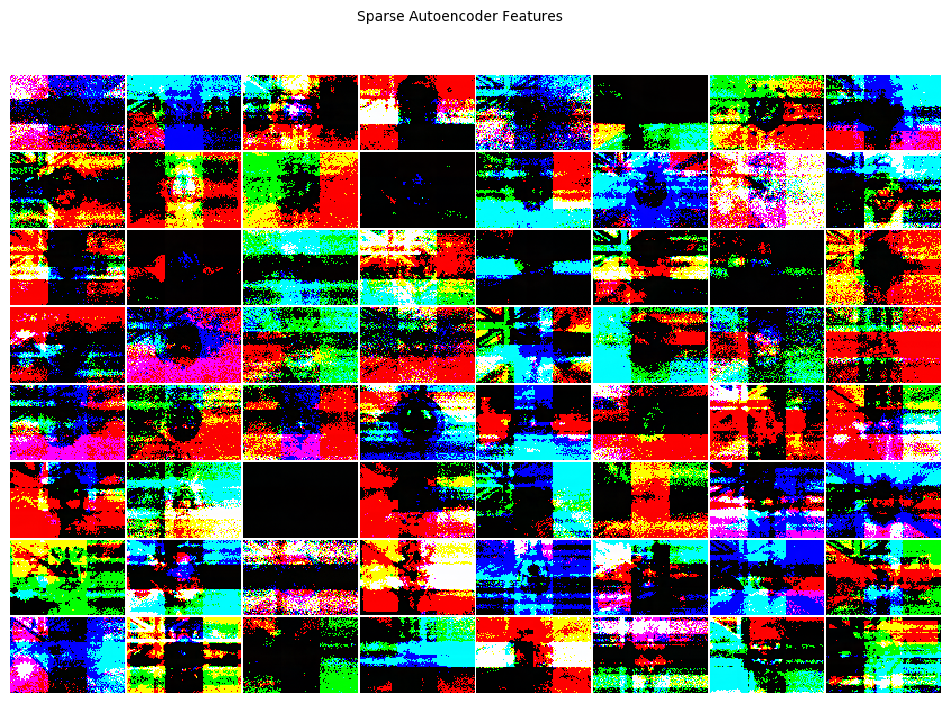
As anticipated, there does in fact appear to be some higher-level "structure" in our flags. In other words, we can now empirically see: a flag is a thing made up of some combination of horizontal stripes, vertical stripes, diagonal crosses, central emblems, the British crest, etc.
Next, let's pass all images back through our network, obtain the 64-dimensional encoding for each, reduce these encodings into 2-dimensional space via the TSNE algorithm, and plot.
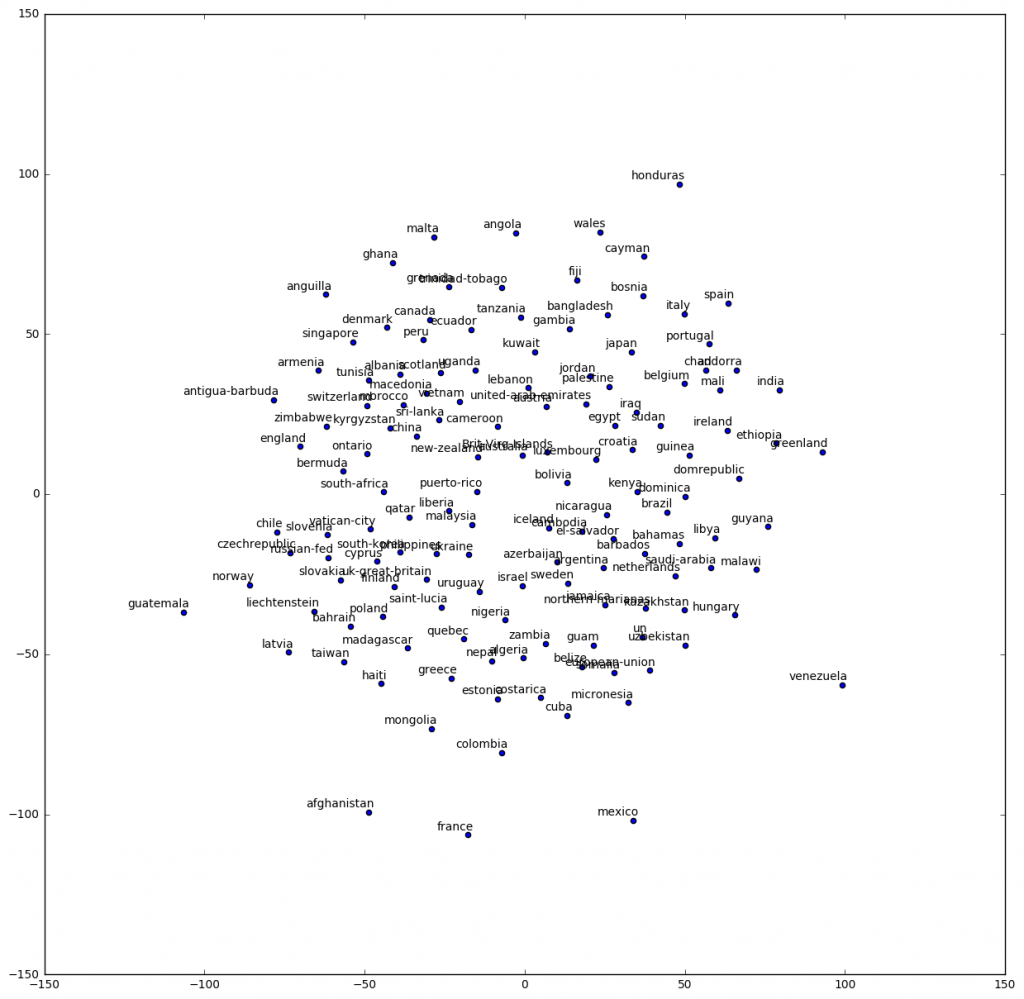
Points that are close together indicate flags that are visually similar. So, what have we learned (or rather, what human intuition have we corroborated with empirical, numerical evidence)? Notable similarities include:
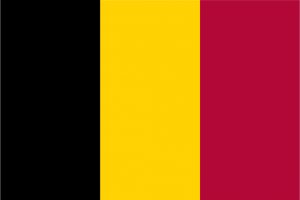
Belgium, Chad and Mali:


Malaysia, Liberia and Puerto Rico:


Canada, Denmark and Peru:


Here, we see that similarity is defined not just across one type of feature, but necessarily, across all. Respectively, the above 3 groups seem heavy in: the "3 vertical bars" feature(s), the "stripes" and "thing in the top-left corner" feature(s), and the "cherry red" feature(s). (I include the optional "s" because the features are not particularly easy to identify nor apparently mutually exclusive in the feature map above.)
Finally, let's generate some new flags. The following images are what happens when we pass the respective composite encodings into the hidden-layer of our auto-encoder, and feed-forward (i.e. pass it through the decoder). The result is then resized back to the original (where more resolution is inherently lost).
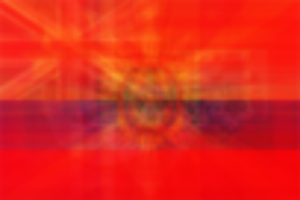
Morocco:

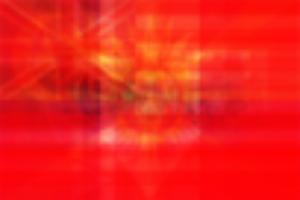
Morocco + Colombia:
Morocco + Colombia + Malaysia:
If only there were more countries in the world such that I could get more data. But hey, we need fewer borders, not more.
Thanks for reading.
Code:
The code and notebook for this project can be found in the links.