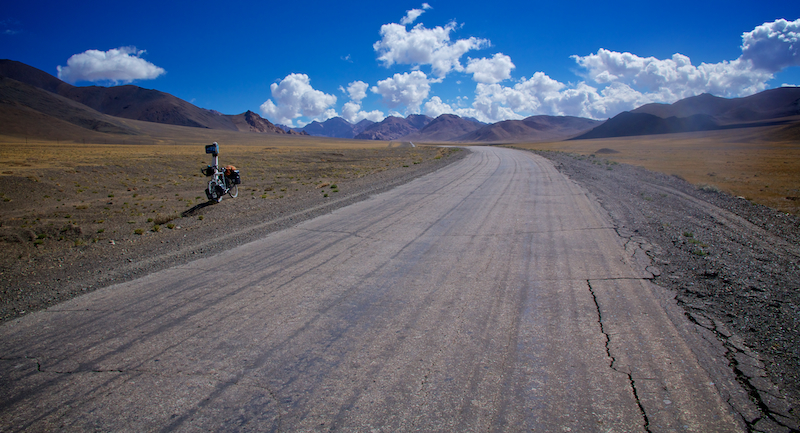
I spent 6 months of my trip around the world traveling on a bicycle. First, I rode from Istanbul, Turkey to Bishkek, Kyrgyzstan, and then through small parts of China and Laos. While you may think I'm crazy, the other cyclists I met along the way would offer a very different perspective. Why? Because the majority of them were Western Europeans, cycling from their front door (in France, for example) all the way to Indonesia.
When I met other cyclists, I'd ask for advice. "What's the next country like? How are the roads? Is it easy to get food and water? How tough is the cycling?" While the information I would receive was valuable, it was always too relative to take at face value. You may find a country difficult or easy - you may have cycled fast or slow. I once met a Polish guy outside a bar in Yerevan, Armenia who had cycled there from Warsaw - roughly 4,000 kilometers away if you divert through Eastern Europe and Turkey as he had done - in a month. There was just no point in comparing myself to this Polish Hercules.
For a better approximation of what's to come - one relative to your own experiences and diagnostic approach - perhaps there's a better way.
After arriving in Kyrgyzstan, I had a strong picture of how easy or difficult I personally felt it was to cycle through the preceding Central Asian countries. If I were to have continued to Indonesia like the rest - through China, Vietnam, Laos, Thailand, Malaysia and Singapore - could I have then predicted how easy or difficult these upcoming countries would be? In this post, I build a linear regression model to do just that.
To each of the countries I had already traversed - Turkey, Georgia, Armenia, Azerbaijan, Kazakhstan, Uzbekistan, Tajikistan and Kyrgyzstan - I assign a difficulty index from 0 to 100, where 0 is very easy and 100 is very hard, based on my own personal experience. Then, I choose some explanatory variables that I feel contribute heavily to this index, as follows:
- Percentage of total land that is arable in each country: A rough indicator of how much food, specifically produce, will be available in a village market. Food is important when you cycle all day.
- Percentage of total roads that are paved: Smooth roads are exponentially easier to cycle than bumpy ones, and even more so when your bike weighs 50kg.
- Population density (persons per square kilometer): In sparsely populated areas/countries - the parts of Kazakhstan and Uzbekistan through which I cycled, for example - it is rather difficult to obtain food, shelter and help if you need it.
- Percentage of population with access to potable water: The smaller this statistic, the harder it should be to obtain clean water.
- Topography index: A discrete integer value from 1 to 4 based upon how hilly/mountainous the country is. I assign this value to each country myself based on my own personal experience.
The data for the first 4 statistics, using values from the most recent years available, is then pulled from UNdata, scaled by mean and standard deviation, and fit with a linear regression model in R. The output quickly shows that only coefficients for "percent paved," "population density" and "water access" are significant to our model. We remove the rest and refit. Below are the coefficients and significances of this new fit.
(Intercept)    60.625      1.301  46.594 1.27e-06 ***
perc.paved     12.496      1.909   6.544  0.00282 **
pop.dens      -13.295      1.647  -8.074  0.00128 **
water.access  -13.980      1.742  -8.025  0.00131 **
First, we note that all explanatory variables are significant at the p = .05 level, as all p-values are less than .05. Next, we make commentary on the coefficients themselves. It makes sense that an increase in water access should decrease our difficulty index; in other words, more water means the country is easier to cycle. The same is true for population density - more people means an easier ride (although this would likely plateau at a certain point - cycling in dense urban areas is never fun). Lastly, we see that an increase in paved roads means an increased difficulty index. At first glance, this makes little sense: shouldn't more paved roads mean the country is easier to cycle? This is certainly possible. However, consider the alternative. A country with a small percentage of total roads paved is likely to be of lower economic standing. The few roads that are paved are more likely to be highly connective and heavily trafficked, and given that building a road on flat land is far easier and cheaper than building roads that burrow through mountains (ahem, China), these roads are more likely to be on easier terrain than they are to be on harder. As a cyclist, I want to be fairly linear and efficient with my route choice, and if we infer that there are only a few highly connective cross-country arteries in a given country, these are more or less the roads to which I am forced to stick. Therefore, in a country without many paved roads, one could infer that on average, the roads I end up taking may in fact be flatter and easier than in a country with a higher percentage of its roads paved. This is one explanation for the positive coefficient.
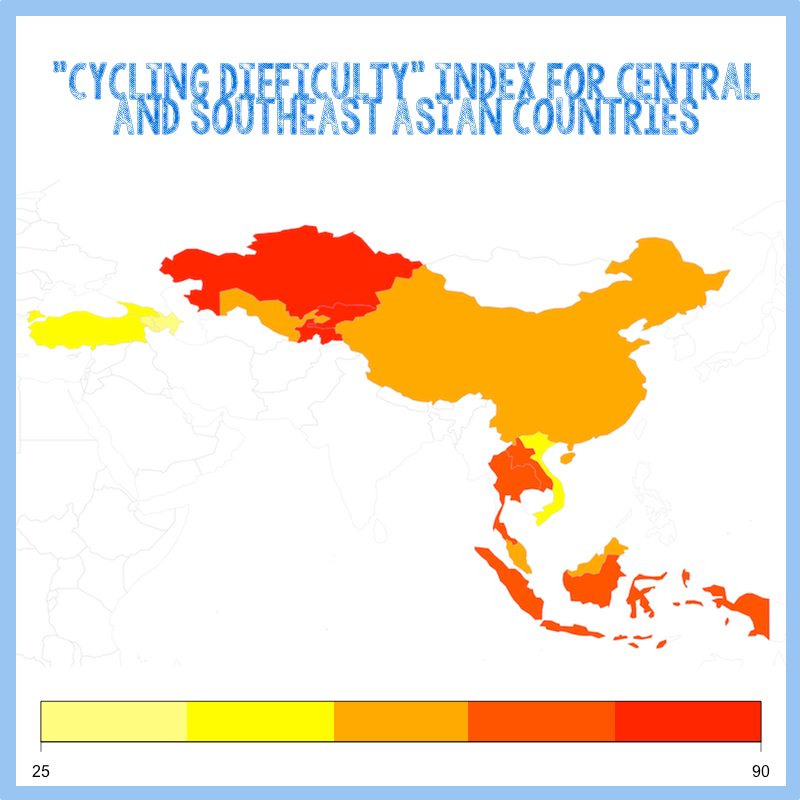
After determining that our model is a good fit (assessing coefficient p-values, and examining the distribution of residuals), we can then pull new statistics for our model's 3 explanatory variables - "percent paved," "population density" and "water access" - for each of China, Vietnam, Laos, Thailand, Malaysia and Singapore - also from UNdata. The table below shows these values as well as the predicted results.
row.names   perc.paved   pop.dens   water.access    diffIDX.pred
China       53.5     141.69292  91.7            60.21643
Indonesia   56.9     126.36795  84.3            71.22042
Lao PDR     13.7     27.00892   69.6            73.15184
Malaysia    80.4     85.74957   99.6            61.14540
Singapore   100.0    8218.39644 100.0           33.20916
Thailand    98.5     129.40705  95.8            73.19419
Vietnam     47.6     268.46655  95.6            52.23755
So, how do our predictions look? I buy 'em. Singapore would definitely be the easiest in which to cycle. Indonesia and Lao would likely be the hardest. China in the middle, though, with an index of 60? Again - I'd buy it. Assuming you can speak some Chinese. Finally, here's a map of our findings. If you have a friend cycling in the area - do pass it along.